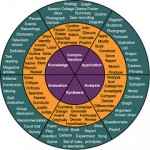
What are infographics and how do they help?
Infographics are those attractively displayed facts and figures that are commonly used to illustrate statistics. They can be in the form of time lines, flow charts, marked maps, pie charts, bar graphs, or vein diagrams. Its sort of like a visual representation of numeric data which makes it easy for the reader to understand the numbers involved. They are attractive and easy to remember as compared to just trying to learn up facts and figures by heart. They are used often in magazines and newspapers and can help improve the understanding of a subject at a glance. That is why its a good idea to use inforgraphics as a teaching aid in the homeschool classroom.
Please login or register to read the rest of this content.
